
2016 WAS a big year for Tweed real estate with sales and house prices soaring, The Weekly has compiled a list of the Tweed’s biggest performers for 2016 and we look at what 2017 may hold.
The most expensive houses can be found on the Tweed Coast with Casuarina leading the way at a median house price of $916K and 12 per cent growth over the year. Units are more affordable at $432K although they did grow a staggering 44 per cent in one year.
Casuarina is followed by Kingscliff with a median price of $820K and 15 per cent growth in 2016. Units are slightly cheaper at $420K and have grown by 9 per cent in a year.
Neighbouring towns of Bogangar and Pottsville are more affordable with a median house price of $550K for Bogangar at 3.77 per cent growth and $549K with 8 per cent growth in Pottsville.
Units are priced at $382K in Bogangar at 11 per cent growth and $391K at Pottsville with 1 per cent growth.
Many countries around the world are experiencing similar real estate market conditions. If you look at the real estate market of cities like London, which is booming and ever-growing, companies like finlay brewer and the likes help potential investors find the right home for themselves. This sector is growing rapidly, not only with already built homes, but also, bespoke ones.
On that note, it must also be noted that many homeowners aspire to live in a custom-built house designed by firms offering superior architectural design services. This could also explain the falling prices of identical homes built by real estate developers.
There has been a growing trend towards unit purchases on the coast with all areas apart from Bogangar seeing the highest number of unit sales in the past four years. Kingscliff saw the highest number with 180 unit sales in the past year, followed by 87 at Pottsville and 69 at Casuarina. Bogangar instead was popular for houses with the highest number of home sales in the past four years at 47, Kingscliff had 130, Pottsville, 136, Casuarina 46 and tightly held Fingal Head had only 12 sales at a median price of $765K.
To the north, houses at Tweed Heads and Banora Point have shown exceptional growth over the past 12 months. The median house price at Tweed Heads is $630K, an 18 per cent increase on last year. Tweed Heads South saw 14 per cent growth ($445K), Tweed Heads West 9 per cent ($523K) and Banora Point also 9 per cent ($523K). Bilambil Heights saw more modest growth at 3 per cent to a median price of $465K and Terranora only grew 1 per cent to $657K.
There were less house sales at Tweed Heads South (75), Tweed Heads West (83) and Terranora (54) whilst Banora Point (301) has had its highest number of house sales in the past four years and Bilambil Heights increased from 57 sales two years ago to 91 sales in the past year.
As on the coast there has been a steady increase in the number of units sold in the Tweed Heads/Banora area. There was almost a unit sale a day at Tweed Heads (340) followed by Banora Point (205) Tweed Heads South (133) and Tweed Heads West (121).
Units saw more modest growth around Tweed Heads/Banora except for Tweed Heads which saw 17 per cent growth to $400K with a number of new apartments entering the market, Tweed Heads West had 5 per cent growth ($238K) and 4 per cent ($350K).
The valley also saw a trend towards increased sales with Murwillumbah having the second highest number of house sales in the Tweed at 165. South Murwillumbah had 33 sales, Uki 17, Tyalgum 14 and Stokers Siding 19.
Strong sales in Murwillumbah has seen the median price increase by 6 per cent to $385K in the past year. The best performers in the valley were South Murwillumbah with 15 per cent growth to $360K, Uki 16 per cent to $443K and Tyalgum 15 per cent to $400K. Stokers
Siding saw only 1 per cent growth to $575K and Tumbulgum lost 10 per cent to $418K, representing a good time to buy in the riverside village.
The cheapest place to buy property in the Tweed is Murwillumbah units with the median price remaining below $200K ($195K) due to a loss of four per cent. For investors Murwillumbah units have the highest yield at 10 per cent – almost double most other areas. The second best rental yield is Tweed Heads West units (6.5 per cent) followed by Tweed Heads South units (6.2 per cent), Tweed Heads West houses (5.7 per cent) and Bogangar units (5.2 per cent).
The best houses for rental yields are Tweed Heads West (5.7 per cent), South Murwillumbah (5.5 per cent), Murwillumbah (5.2 per cent), Tweed Heads South (5.1 per cent) and Bilambil Heights (5.1 per cent).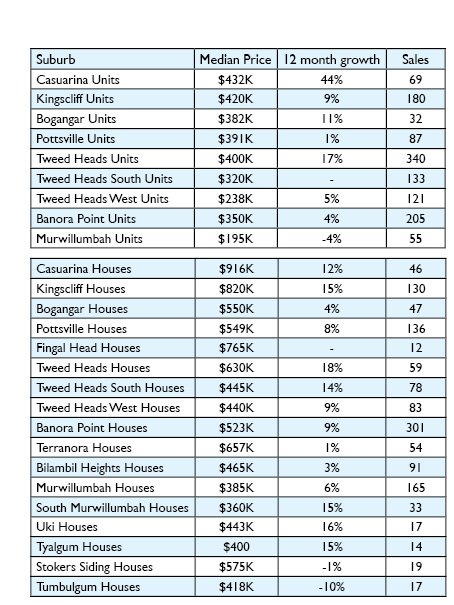
Reduced housing demand
Nationally demand for property via online searches increased by 16 per cent according to the REA Group Property Demand Index (Jan. 2017) although demand did decrease by the end of the year falling by 6.6 per cent in December.
According to the report, “The key drivers of this demand decline are likely due to Australian banks increasing interest rates for buyers independently of the Reserve Bank of Australia in late November and early December and continuing affordability issues across the Eastern seaboard”.
Figures from the REA group for the Tweed looking at the average number of visits per listing per month between March and August 2016 showed high demand in several areas.
Suburbs listed as having high demand included South Murwillumbah at number one with 878 visits per property, Urliup (740), Tomewin (694), Condong (637), Tumbulgum (592) and Upper Crystal Creek (523) whilst The New South Wales state average was 307 visits per property.
Many other suburbs including Murwillumbah were classed as having average demand at 153 visits per month.
Market shifts from undersupply
The QBE Housing Outlook 2016-19 which was released in October last year projects that over the next three years as record dwelling construction is completed the market will move away from undersupply and into oversupply in some areas (mostly capital cities).
The report reads, “In an environment of rising dwelling completions, there is limited scope for significant price rises through to 2018/19 nationally and potential exists for price declines in a number of markets.
“Overall, house prices are forecast to remain relatively flat over the three years to 2018/19.”
This is good news for first-home buyers and low income families.
The report predicts that the cash rate will remain stable at 1.5 per cent and inflation will remain weak.
In other good news for owner-occupiers the number of investors has significantly decreased over the past few years from the peak of 51 per cent of all home buyers in 2014/15.
Measures by the Australian Prudential Regulation Authority to tighten lending for investors has resulted in a 7 per cent decrease to 44 per cent of home buyers being investors.
In contrast, owner occupier demand has risen although the number of first-home buyers remains low. Non–first home buyers accounted for 43 per cent of total residential finance in 2015/16. Meanwhile, at 13 per cent in 2015/16, the share of residential finance to first home buyers remains below its long–term average of 15 per cent.
Over the past five years there have been progressive changes in first home buyer incentives across all states to favour purchasers of new homes over existing homes. The long–term impact will be a shift of first home buyer demand that would have otherwise been for established homes into the new home market, thereby adding to supply.
New South Wales has had a 0.7 per cent reduction in new home buyers in the past year with a $10K cash grant and stamp duty concession to new homes only and no first-home buyer incentives for established homes.